Map Controls & Tools
The Controls menu toggles two kinds of on-map helpers: the built-in MapLibre map controls, and the component panels that add tools like Measure and Bookmark. A check mark next to an item means it is currently shown.
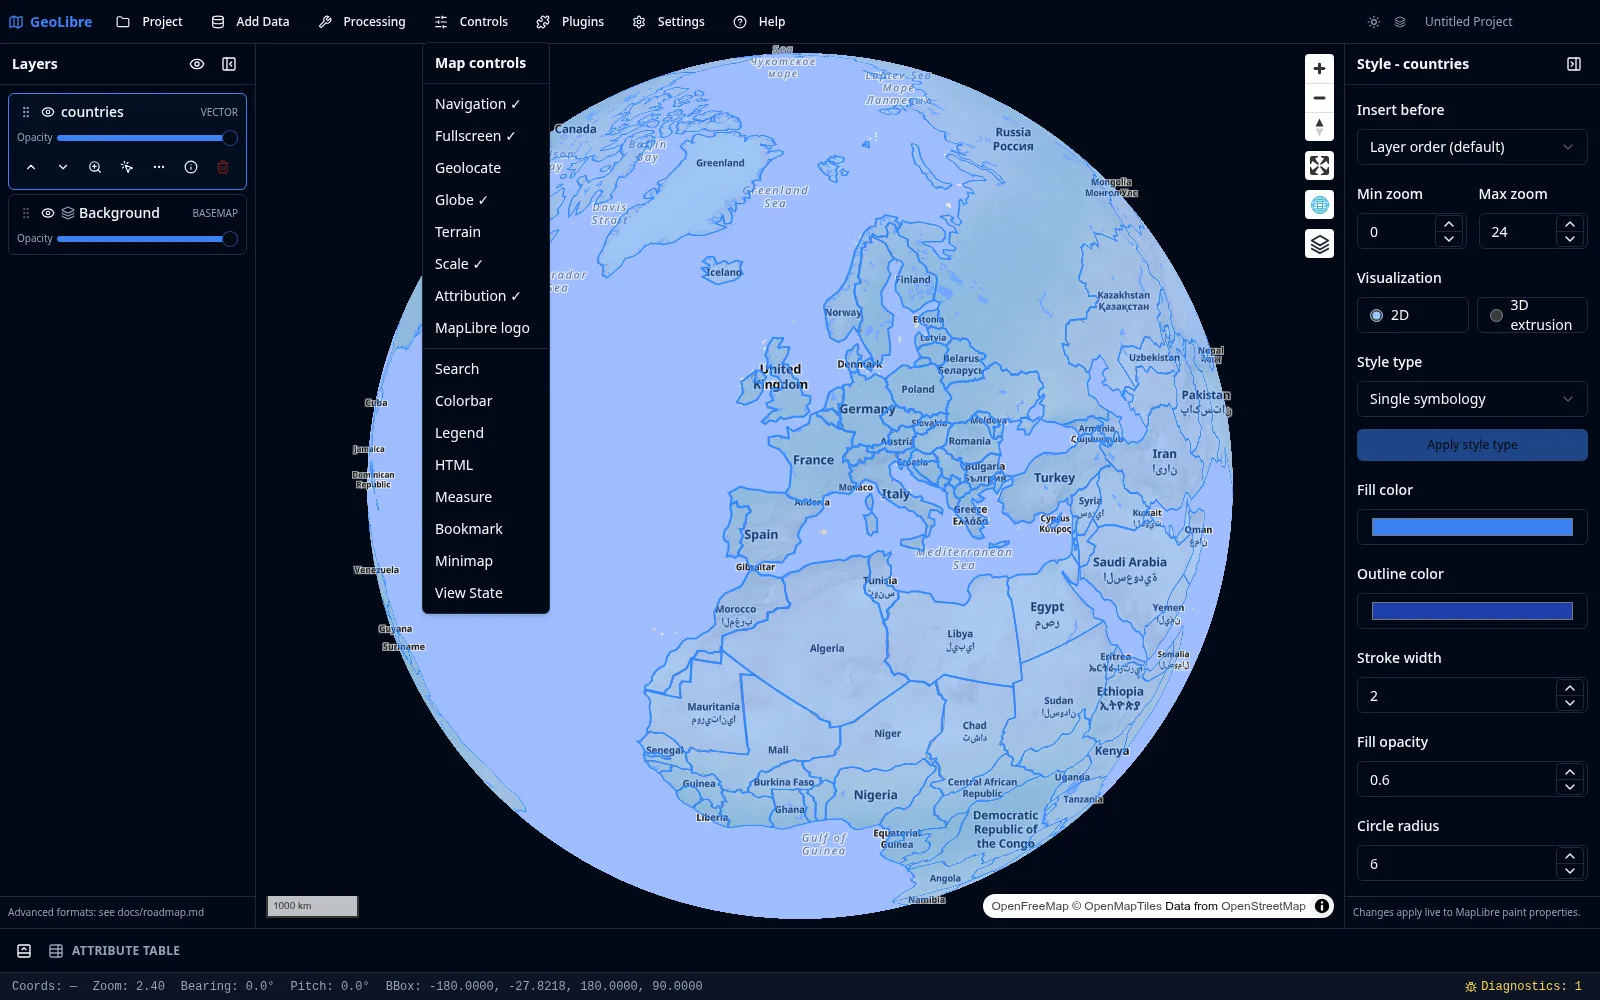
Map controls
These are the standard MapLibre controls that sit in the map corners:
| Control | Description |
|---|---|
| Navigation | Zoom in/out and a compass to reset bearing. |
| Fullscreen | Expand the map to fill the screen. |
| Geolocate | Center the map on your current location. |
| Globe | Switch between the flat map and a 3D globe projection. |
| Terrain | Toggle terrain (3D elevation) rendering. |
| Scale | Show a scale bar. |
| Elevation | Report the ground elevation under the pointer in the status bar. Off by default — see Elevation readout. |
| Attribution | Show data attributions. |
| MapLibre logo | Show or hide the MapLibre logo. |
Component tools
These are interactive panels provided by the MapLibre components plugin:
| Tool | Description |
|---|---|
| Search | Search for places by name and fly to the result. |
| Colorbar | Display a continuous color scale for raster values. |
| Legend | Show a legend describing the layers on the map. |
| HTML | Display custom HTML content in an on-map panel. |
| Measure | Measure distances and areas interactively, with heading and terrain-aware 3D readouts. See Measuring distance, area, and heading. |
| Bookmark | Save named map views and jump back to them. |
| Minimap | Show an overview map of the current extent. |
| View State | Read and edit the exact center, zoom, bearing, and pitch. |
The Print Layout composer lives under the Project menu.
Control position
Plugin-backed controls can be positioned in any map corner. For plugins that support it, set the corner from the Plugins menu (top left, top right, bottom left, or bottom right).
Measuring distance, area, and heading
Controls → Measure draws a line or polygon on the map and reports it in the Measure panel. Beyond distance and area, the panel adds two further sections:
- Heading — the direction of the measured line, as degrees plus a 16-point compass label (for example
310° NW). This is a true great-circle initial bearing, not the angle the line makes on screen: on a Mercator map Washington to London looks due east, while the real initial bearing is about 50°. On a path with more than two points, the heading is the overall first-to-last direction rather than one row per segment. - Final heading — the bearing arriving at the far end. A great circle changes direction along its length, so this row appears only on lines long enough for the convergence to reach a degree; short measurements stay a single row.
- Terrain (3D) — slope-following distances when 3D terrain is enabled. This section hides itself when no elevation data is available; the heading rows do not, because a bearing is pure geometry on the measured coordinates and needs no DEM.
Right-click quick actions
Right-clicking the map opens a context menu built around the coordinate you clicked:
| Item | What it does |
|---|---|
| The coordinate | Shown at the top in a monospace font; click it to copy to the clipboard. |
| What's here? | Pull up the Wikipedia knowledge card for that place. |
| Copy as GeoJSON | Copy the clicked point as a GeoJSON Feature. |
| Center map here / Zoom in here | Fly the camera to the point, optionally one zoom level closer. |
| Quick analysis | A submenu of one-click analyses — see below. |
| View in Google Maps / View in Google Earth | Open the same location in an external map. |
Quick analysis from a clicked point
The Quick analysis submenu runs a tool on the coordinate you right-clicked, with no dialog and no need to first create a point layer:
| Action | Description |
|---|---|
| Buffer … here | Three distance presets around the point. The presets follow your Scale bar units preference — 500 m / 1 km / 5 km for metric, 0.25 mi / 1 mi / 5 mi for imperial. |
| Drive time from here | 5-, 10-, and 15-minute drive-time isochrones. |
| Walk time from here | The same contours on foot. |
| Viewshed from here | What is visible from the point, within 2 km, 5 km, or 15 km. See Viewshed. |
| Open in Processing… | Open the full Processing vector dialog instead, for the parameters the presets don't expose. |
Results are added as new layers, and a banner reports progress and any failure with a link to the run's entry in Processing History.
The same Quick analysis submenu also appears in each vector layer's actions menu in the Layers panel, where it operates on the whole layer instead of a point: Buffer all features by …, Centroids, Convex hull, and Bounding box.
Drive and walk time call an external service
Isochrones are computed by a Valhalla routing server — by default the public FOSSGIS instance at valhalla1.openstreetmap.de, so the clicked coordinate leaves your device. GeoLibre asks for consent the first time. Self-hosted deployments can point at their own server; see Self-Hosting.
Viewshed from a clicked point
Quick analysis → Viewshed from here computes the terrain visible from the clicked point and drapes it over the map as a translucent overlay.
- No DEM to prepare. The elevation comes from the same public terrain tiles the map's 3D terrain control uses, fetched on demand for the square around your point. You do not have to find, download, or load a DEM first, and 3D terrain does not have to be switched on.
- Observer height is 1.8 m — a standing person — above the ground elevation at the clicked point.
- Radius is one of the three presets, from 2 km to 15 km. The underlying tool accepts anything from 100 m up to a 50 km ceiling.
- The result is an image overlay layer named
Viewshed (5 km)or similar, so it gets opacity, reordering, zoom-to, and removal like any other layer, and it is saved with the project.
What the quick viewshed does not model
Earth curvature and atmospheric refraction are ignored. Over a few kilometres that is immaterial, but at the 50 km ceiling the curvature drop alone reaches roughly 180 m — enough to matter for a radio line-of-sight study, if not for "what can I see from this overlook". The public terrain tiles are also a global, generalized elevation model rather than a survey-grade DEM. For a rigorous analysis against your own DEM and your own station points, use the Viewshed tool under Processing → Whitebox Toolbox, which this quick action deliberately does not replace.
Camera, overlay, and recording tools
The Controls menu also carries tools that move the camera, drape live data over the map, or capture what you see:
| Tool | Description |
|---|---|
| Sun | Simulate the sun's position and the day/night terminator for any date and time. |
| Weather | Overlay near-realtime Clouds (NASA satellite imagery, animated day by day) and Precipitation (RainViewer radar, animated over roughly the last two hours). |
| Gridlines | Draw a coordinate grid with edge labels, including a UTM easting/northing mode. |
| Spinning Globe | Slowly rotate the globe, optionally bounded to a region. |
| Route Animation | Animate a marker along a line layer with play/pause, speed, a trail, and camera follow. |
| Flight Simulator | Fly over terrain and 3D layers with continuous keyboard controls. |
| Atmospheric Effects | Render a deep-space backdrop, starfield, comets, and an atmospheric halo at low zoom. |
| Directions | Click the map to add waypoints and get a route. Waypoints are sent to the public OSRM demo server. |
| Reverse Geocode | Click the map to look up an address at those coordinates through the configured geocoding provider. |
| Record Map Tour... | Capture an animated keyframe tour to video, with per-keyframe recapture, hold and transition durations, and a saveable tour setup. |
| Record Video... | Record the map canvas, or a drawn bounding box, to a video file, optionally burning in on-map HTML, legend, and colorbar panels. |
Some tools call external services
Directions and Reverse Geocode send your coordinates to a third-party service — the OSRM demo server and your configured geocoding provider. Weather fetches overlay imagery from NASA and RainViewer. The rest of the table runs locally against tiles the map already fetches.
Annotations and the Elements panel
The annotation tools draw on top of the map: Text, Arrow, Rectangle highlight, Ellipse highlight, Freehand highlight, Pin marker, Sticky note, and Placed image. Each has a color, and the stroked shapes (Arrow, Rectangle, Ellipse, and Freehand) also honor the line width. You can delete the last annotation or clear them all.
Annotations are saved with the project, and the Elements panel lists them so you can find and manage each one instead of hunting for it on the canvas. Most elements are anchored At Point — a geographic coordinate they move with. Placed image additionally offers Pinned to Extent, which stretches it across a bounding box so it scales with the view.
Review comments
Comments are anchored notes for review and feedback, kept separate from annotations because they are a conversation rather than map decoration.
- Activate the comment tool from the Comments panel on the right sidebar, then click the map to drop a pin and write the note. GeoLibre asks for your name once and remembers it.
- Each pin opens a thread you can reply to, resolve, reopen, or delete.
- Filter the panel by Open, Resolved, or All. Resolved pins are hidden from the map while the Open filter is active.
- In a live collaboration session, adding, replying, resolving, and deleting all sync to the other participants.
Comments are stored in the .geolibre.json file, so they travel with a shared or saved project even when no session is running.
GPS tracking
Controls → GPS Tracking... follows a live position on the map, records a track log, and can digitize new features straight from the feed. Pick one of two entries under Position source:
- This device — the browser or OS geolocation API. This is the default and needs no extra hardware.
- NMEA receiver (serial or Bluetooth) — an external GPS/GNSS receiver, for survey-grade or high-rate positions. Choose a baud rate and use Connect serial or Connect Bluetooth; the dialog then reports the device name and a running count of parsed sentences and fixes.
NMEA needs a Chromium browser
Reading a receiver uses the Web Serial and Web Bluetooth APIs, which Chromium browsers such as Chrome and Edge provide but Firefox and Safari do not. Most Bluetooth GPS receivers speak classic Bluetooth rather than Bluetooth Low Energy: pair those in your operating system's settings and they appear here as a serial port. Use Connect Bluetooth only for Bluetooth Low Energy receivers.
Controls → Field Collection... is the related tool for capturing observations against a custom form. See Features.
Map navigation basics
- Pan: drag the map, or use the arrow keys while the map has focus.
- Zoom: scroll wheel, pinch, the navigation control, or the
+/-keys. - Rotate: hold the right mouse button and drag, use the compass, or
Shift+←/→. - Tilt: hold
Ctrl/Cmdand drag to tilt the map into a perspective view, orShift+↑/↓. - Reset the view: press
Nfor north up,Ufor a top-down view, orRto reset both pitch and bearing. See the interface guide for the full shortcut list.